Visual Management - The ABCs of Lean Manufacturing. Development of a continuous improvement system at MegionEnergoNeft Visual management tools
We thank the SIBUR Press Center for providing this material.
Did you know that approximately 90% of the information a person brings is vision? Today, visualization (largely, by the way, thanks to modern technologies) affects almost all areas of our lives. Most PSS tools are also based on the visual designation of processes, tasks, key indicators, labor protection rules and industrial safety. All this is presented in the form of graphs, tables, diagrams, drawings, which are simple and therefore understandable to everyone.
Visual display of the process simplifies control and timely correction own work, and also allows you to better navigate the tasks that colleagues face, offer options for solving problems and jointly search for solutions. Visualization helps the manager: he spends less time explaining the details, and besides, he can be sure that the employees of the department are aware of the current state of affairs.
Let's try to figure out how to manage the "Individual Executive Board" (IDR) and the "Visual Performance Management Stand" (VVUE), and also look at the reviews of advanced users.
Good reminder and powerful irritant

Vasily Nomokonov, Managing Director, Production Efficiency, Energy and Innovation:
The board is a good reminder. But besides that, it is also a powerful irritant. When I see a minus in front of a task, I try to correct it to a plus as soon as possible. At the booth, I reflect those standards and practices that, as it seems to me, I paid less attention to before. For example, now I began to devote more time to linear bypasses.
Employees up to date with important news
 Rustam Galiakhmetov, Director of Production Efficiency and Industrial Safety:
Due to the specific location of our Competence Centers (CC), the workplaces of managers are in the same room as the workplaces of their subordinates. It turns out that the leader does not need a separate board. As a result, we abandoned the IDR, having decided that each Central Committee should have one common board, on which not only the tasks set by the head would be displayed, but in general the whole life of the unit. There is only one exception - my individual leader board.
Boards are located in the meeting room. This is a place where everyone visits often enough that colleagues from other departments can also find out what is happening at this stage. Employees of the unit fill in the board in turn, once a week, voicing goals, tasks, problems in front of the whole team. As a result, all employees are aware of important news.
Visual control allows you to make quick decisions
 Aksana Kozlova, HR Director of Voronezhsintezkauchuk OJSC:
The use of the IDR gives a general idea of what the strategic and current tasks are facing the service. With the help of IDR, you can publicly declare gratitude and thus motivate an employee. The IDR is very disciplined. Like visual control allows you to make quick decisions. A big plus of such a working tool is that you definitely will not forget everything recorded on the board. Updating information on the stand takes quite a bit of time - literally 5-10 minutes a day. If we objectively evaluate the duration of work processes, it becomes clear that we spend much more time looking for tasks in our diaries.
KPIs are formulated and are constantly in full view

Alexey Sabelnikov, Chief Power Engineer of Tobolsk-Neftekhim:
Filling out the manager's board helps me first clearly formulate the priority tasks for the month, and then visually monitor their implementation and adjust short-term tasks in order to maximize my KPIs (since KPIs are formulated and are constantly in everyone's mind). The information reflected in the standard work block allows colleagues to understand what time I am busy.
Using the board disciplines
 Mikhail Gordin, Managing Director, Synthetic Rubber Directorate:
I used to think that it was still strange to draw everything on paper when there is Outlook and a lot of other more modern ways of planning. But over time, I became convinced that the IDR helps in my work. I noticed that using the board is disciplined. I have several individual appointments booked in my Outlook calendar each week. Initially, I leave them empty, without names. At the beginning of each month, I look at who I've talked to recently and who I haven't, and I start renaming these meetings and assigning them in Outlook, and mark them with crosses at the IDR stand. As a result, my personal discipline improves. In addition, when you fill out the IDR, you always think about what problems and tasks are the priorities at the moment.
Opportunity to commend distinguished employees
 Vyacheslav Zavyalov, head of the repair shop technological installations, repair production "Tomskneftekhim":
I believe that the performance standard of a leader has a two-pronged effect. I can judge by myself: as a subordinate, I have gained some advantages from its implementation, and as a leader. The head of the repair production has an information board on efficiency, looking at which you always refresh your memory important points. As a leader, I, in turn, can publish thanks to distinguished employees on a personal board, visually tell my subordinates about plans for the day or, say, for the week.
Visualization is only one layer of the manager's work standard (CPP). There are many advantages from other tools: efficiency talks, delegation... Of course, most of these approaches have been used before, but not so systematically, without a theoretical basis. CPP has significantly optimized the work.
New series . This part is dedicated visual management. The video provides a definition, gives examples, tells what questions visual management can answer, with what tools and in what sequence visual management should be implemented. See.
visual management is the location of all tools, parts, production steps and performance information production system so that they are clearly visible, and so that any participant in the process can assess the state of the system at a glance.
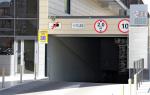
What does production look like in “normal condition”?
Looking at this or that workshop, it is very difficult to determine what is happening in it and what should be happening. Try to look at this photo and answer the following questions:
- How many people should work here?
- How much should they produce?
- How much has been harvested for assembly by different teams?
- How much unnecessary equipment is there?
- And how much marriage is made?
It is very difficult to answer these questions in this situation, because the eye has nothing to catch on, it is not clear how to evaluate certain criteria.
Visually understandable space
In a "visually understandable" space, things are completely different. Shown here are photographs that provide examples of how production is organized, how office work is organized, and how certain information is presented to make it easier to understand. These are task cards. These are the standards for performing operations. These are work plans. This is the layout of the equipment. This is the layout of office equipment. This is a cross-training table. It is also kanbans and products that themselves act as orders.
The same applies to the office. AT this case examples are given of several companies that use one way or another to indicate their plans for completing tasks. These are kanban boards, these are tables in which development plans are visualized, these are tables in which the workload of people on certain tasks is indicated.
Here is a small list of questions, the answers to which can actually be “seen” in production or in the office:
- What part of the shift plan has already been completed
- How many materials are needed to complete production
- What tool is used in the work
- What equipment is installed on the machine
- How to properly perform the operation
- What are the problems facing production today?
- What are the indications key parameters machine tool
- What is the level of products without defects
- What is the rate of injury at work
Agree, it would be very good to be able to receive this information immediately when it is required, and not ask those people who work in the work area about what the answers to these questions are.
Visual management tools
There are a number of visual management tools, here I present a few of them.
- This is Kanban as a visual planning tool.
- It's 5S
- These are the videos of the incidents
- visual standards,
- visualization of problem analysis (Pareto chart, fishbone, etc.)
- visualization of key indicators of workplaces
- cross learning table
- and visualization overall indicators enterprises
Stages of implementation of visual management
Visual management is implemented in several stages.
During the first stage, the organization of jobs is carried out. This is the stage at which you need to use the full power and capabilities of 5S.
At the second stage, important information is visualized that is located at the workplace: information about safety, about quality, about how operations are performed and about what and how equipment should be used.
At the third stage, the results and performance indicators of a particular process are visualized.
And at the fourth stage of the implementation of visual management, decision making is introduced based on this visualized information.
This A complex approach, which allows you to focus on achieving results and achieve the best result with the resources available.
Management by objectives includes:
- cascading and clear formulation of goals from the top level to the level of performers;
- ongoing monitoring of results and their evaluation;
- feedback and corrective actions;
- understandable and accepted by employees criteria for evaluation their work, and, as a result, employees are more motivated for the performance of their duties;
- constant feedback and possibility of prompt assessments and activity adjustments employees and departments;
- visual management is an approach that provides activities with simple visual signals to quickly respond to changing conditions and circumstances.

What indicators to use for visualization?
The control system must provide cascading the goals of the manager to each employee. This ensures the focus of each employee on the implementation of priority tasks and the achievement of priority indicators. The goals of each employee should be tied to the goals of a higher manager. The goals of each leader must be completely decomposed into the goals of subordinate employees.
An example of regular meetings are morning meetings. To sum up the day and relieve emotional stress, meetings can also be held at the end of the working day.
Using visualization boards to reflect KPIs
Visualization boards serve:
- for visualization of quantitative indicators;
- to communicate the unit's current goals;
- to visualize current problems and those responsible for their resolution;
- submission of proposals for improving the work of the unit (kaizen).
Visualization boards are effective performance management tool each employee and the entire department.
| Basic principles of MBO (Management by Objectives) | Description |
|---|---|
| Hierarchical subordination of goals | From more general goals, more local ones are formulated. |
| cyclicity | Any management system is a closed cycle "analysis - planning - implementation - evaluation and control", which is repeated many times |
| Feedback | Feedback is essential to maintaining the stability of any system. Feedback is a confirmation of understanding of something, as well as a reaction (positive or negative) to any action. |
| Specific and measurable goals | Goals should be expressed in concrete terms that can be measured. |
| Regularity and constancy of work on goals | Goals are developed for a certain period, after which the degree of their implementation is assessed and goals for the next period are developed. |
| A single standard for the design of goals, plans, reports | Forms uniform for all facilitate the process of analysis, comparison and decision-making on the coordination of goals among themselves |
| Participation principle | In the process of developing goals, all employees take part, this increases the involvement of everyone in the organization, increases awareness, and, consequently, awareness of activities, which significantly affects the motivation of staff |
| The principle of holism | This principle consists of two parts: the principle of coordination and the principle of integration. Organizations are divided into levels, each level - into units that differ in functions, powers and responsibilities. Coordination covers the interaction of units of the same level, i.e. horizontally, integration - between units of different levels, i.e. vertically. The combination of the principles of coordination and integration gives us the principle of holism, according to which, the more elements and levels in the system, the more profitable it is to plan simultaneously and in interconnection. |
In addition to motivating employees and stimulating healthy competition, the Board allows employees to see the decomposition of the unit's goals into individual goals, and also allows the manager to track the dynamics of indicators.

Visualization board - photo
Management indicators and their impact on KPI - management by objectives
The system of management indicators of the unit determines:
- list of management indicators;
- method (technological map) for collecting information and calculating indicators;
- the relationship of indicators;
- responsible for collecting and updating indicators;
- update frequency;
- the required depth available for detailed analysis of indicators;
- method of presenting information.
Management Scorecard must be aligned with the objectives of the unit(KPI, PPR) and allow for both operational and medium-term management based on quantitative indicators.
Power on required process indicators and innovation activities departments in the system.

Video - Using visual management. Visual management and goal management
Lean production (Lean system) is a special approach to the organization of management in an enterprise. It aims to improve the quality of work by reducing waste. Michael Vader talks about the intricacies of this concept in his book. Instruments lean manufacturing are used at all stages of the enterprise - from design to product sales. Let's consider them in more detail.
Lean tools and their essence
The basic principles were developed in the late 1980s-1990s. main goal of the system is the reduction of actions that do not add value to the manufactured product during its entire life cycle. When choosing tools and methods for lean manufacturing, you should be guided by the following principles:
- Develop leadership at every level of process management.
- Team leaders must develop long-term and short-term strategies using the information received from subordinates.
- Each leader is responsible for the results of their own projects.

The use of lean manufacturing tools is focused primarily on improving the quality of work. It should be evaluated at all levels, and the results should be received by all employees. The enterprise should develop clear instructions and rules for each group of specialists. At the same time, it is necessary to ensure their close relationship and mutual assistance. It is necessary to teach personnel to identify production errors in a short time and correct them just as quickly. To involve all employees in the implementation of the concept, certain standards of key quality parameters should be developed.
Lean Tools: A Mini Guide
The main task of the management of the enterprise, striving to improve the quality of products through the reduction of losses, is the creation of a well-defined scheme of actions. The development of instructions and rules should ensure the formation complete system, increasing staff motivation. They must have a logical relationship with each other. The following main tools of lean manufacturing are distinguished in the system:
- visual management.
- "Just in time."
- Standard operating processes.
- Mapping.
- Organization of places 5S.
- Built-in quality.
TRM
Total Productive Maintenance is universal service process. As mentioned above, lean manufacturing tools are aimed at reducing waste. As a rule, they are associated with equipment downtime due to breakdowns and excessive maintenance. The main idea of TPM is the involvement of all employees of the enterprise in the process, and not just specialists from individual services. Thus, each employee must know the specifics of equipment maintenance and be able to quickly fix the problem on their own. The success of using TPM depends on how well the idea is conveyed and positively received by the staff. 
TRM stages
The implementation of lean manufacturing tools requires following a predetermined pattern. The peculiarity of TRM lies in the fact that on the basis of this approach, a planned and smooth transformation of the existing service system at the enterprise into a more perfect one is possible. To do this, the TRM includes the following steps:
- Operational repair. It involves an attempt to improve the existing system by identifying weak areas in it.
- Service based on forecasts. It's about on organizing the collection of information about existing problems in the operation of equipment for subsequent data analysis. Along with this, it is planned to prevent machines.
- Corrective maintenance. Within its framework, equipment is being improved to eliminate the causes of systematic failures.
- Autonomous service. It involves the distribution of functions related to ensuring the smooth operation of machines between the repair and maintenance services of the enterprise.
- Continuous improvement. This element includes all lean manufacturing tools. Continuous improvement actually means engaging employees in a constant search for the causes of losses and suggesting ways to eliminate them.

visual management
It is an arrangement of parts, tools, production operations, information about the performance of work, in which they will be clearly visible. This will provide process participants with the opportunity to assess the status of the entire system at a glance. The implementation of visual management is carried out in several stages:
- Jobs are organized.
- Important information about safety, quality standards, order of operations and use of equipment is visualized.
- The results are shown and the effectiveness of the processes is evaluated.
- Decisions are made in accordance with the visualized information.
Standard Procedures
It should be noted that lean manufacturing tools are designed in such a way that their use can only be carried out in a complex manner. Otherwise, the activity will not bring the expected effect. The system develops special instructions, which define the step-by-step sequence of execution of any operation. Oral recommendations are either distorted or forgotten. In this regard, they are replaced by written instructions, for which the following requirements exist:
- They should be accessible for quick understanding. To do this, instead of long texts, diagrams, drawings, photographs, and special symbols are used.
- Constantly reviewed and updated in accordance with changes in the order of operations.
- Develop with employees. This will ensure their credibility and ensure that they are received positively.

Just in time
Just In Time is a way to reduce lead time by providing services, materials and other resources only when they are needed. This allows you to do the following:
- Reduce the volume of batches to the minimum economically advantageous.
- Balance the number of employees, equipment, material.
- "Pull" products - the performance of current operations is determined by the needs of the upcoming ones.
- Use audio-visual methods to monitor the status of the product and the workload of machines.
- Delegate decision-making on managing the movement of goods to the lowest possible level.
Mapping
It represents the process of creating a simple graphic diagram that visually depicts information and material flows required to provide services or products to end users. Mapping allows you to immediately identify bottlenecks, and, based on the results of its analysis, determine unproductive operations and costs. Based on this, an improvement plan is developed. As the time of value creation, it is customary to take the period of work, through which the product is transformed so that the consumer is ready to pay for it. The creation flow is all the activities that are required to produce it. As practice shows, most enterprises lose up to 80%. 
Stages of creating a schema
Mapping includes the following activities:
- Documentation of the current state. At this stage, the process of creating any value (or a group of them) is described in detail. In this case, all states and operations, the required time, the number of information flows, the number of employees, and so on are indicated.
- Analysis. Mapping is carried out to identify actions that form and do not form the value of the product. Some of the latter cannot be eliminated (for example, accounting). However, they need to be optimized as much as possible. Others can be eliminated or unified. To implement these tasks, it is necessary to find out the customer's requirements for the quality of the product and its consumer properties. Based on this, those characteristics are established that cannot be excluded under any conditions, and those that can be corrected by agreement.
- Create a future state diagram. Such a map reflects the ideal situation after making all the planned changes. At the same time, hidden losses are revealed for their subsequent elimination.
- Development of an improvement plan. At this stage, methods of transition to the ideal (future) state are determined, specific tasks are assigned, deadlines and persons responsible for the implementation of the program are established.
built-in quality
This technique allows you to manage the state of the product directly at the place of its creation. Built-in quality provides:

5S
This system assumes efficient distribution and organization of the working space. It, like other lean manufacturing tools, helps to increase the manageability of the zone and saves time. The system includes:
- sorting.
- Rational use of space.
- Cleaning.
- Standardization.
- Improvement.
The 5S system allows you to reduce the number of errors in documents, create a comfortable climate in the enterprise, and increase productivity. The undoubted advantage of this tool is the absence of the need to use new managerial theories and technology.
visual management(visual workplace) is a clear statement of all standards, goals and conditions of work in the field, it is an opportunity to compare the actual state of affairs with the requirements for production efficiency, provided to each employee. On this basis, you can implement activities aimed at bringing the product in line with the requirements. Forms of visual management:
- Hanging and using standards (methods, quality, maintenance, supply of material, number of parts)
- Posting goals (presence in the workplace, quality, productivity, costs, machine time, delivery time)
- Monitoring and posting the results achieved (bridging the gaps between the planned and actual state)
- Trouble warning (visual and/or acoustic)
- Warning in the event of defects (visual and/or acoustic error message).
It is important that the posted information is specific to specific jobs/processes. Post general information about general departments or the operation of the entire enterprise does not make sense.
Visual management is understood as a set of information and methods that support employees in the performance of their work and provide feedback.
Note: It is not enough to just post information. It is important that each employee considers this information as part of their work functions and thereby continuously improves the work process.
Visual devices are important in transforming traditional manufacturing into Lean manufacturing. Actually, this definition serves as a key improvement force and ensures that Lean improvements are clearly readable, understandable, and consistently followed after the implementation of Kaizen activities. Visual management and the 5S program are carried out simultaneously.
The primary cause of inefficient spending is a lack of information - employees simply lack the knowledge of how they can make their jobs more efficient. This forces employees to waste valuable time searching, moving, waiting, repairing, reworking, or even simply giving up! Visual management addresses this issue by making significant improvements in productivity, quality, customer satisfaction, security, and so on (see Figure 1)
Scheme 1. Combination of workplace organization and visual management
Examples.
1. Hanging standards and boundary samples.
Displaying good and bad parts in the workplace, with comments on why those parts are good or bad. Particular attention should be paid to details that are "almost good" or "almost bad" (edge cases). All criteria for determining good parts and defective parts must be clearlyinstalled.
2. Stop/Go signals
All forms of visual and/or acoustic signals giving information about the state of the process, such as "alarm" lights, sirens, etc.
3. Andon systems.
They are a light board or a system of conductors that allow you to clearly determine the place and type of the problem situation. These systems support the employee in a situation where he needs help during the process. Such systems are used by world-famous firms to automatically stop the process if a problem cannot be quickly resolved.
4. Auto-no-mation
Automatic stop device in automated installations that stops the production cycle when it occurs emergencies(e.g. monitoring violations during drilling). In this way, the production of defective parts is prevented, the problem is investigated and corrected before the process goes any further.