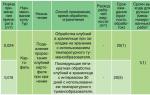
Average profitability of sales by industry. Tax burden coefficient by type of economic activity
Stanislav Dzhaarbekov, Deputy Director, Chairman of the Expert Council
Institute for the Development of Modern Educational Technologies (IRSOT),
lawyer, certified auditor, member of the Moscow Audit Chamber
Let's talk about new data provided by the Federal Tax Service of Russia. These are data on tax burden and profitability for 2016.
Let me remind you that by Order of the Federal Tax Service of Russia dated May 30, 2007 No. MM-3-06 / [email protected]“On Approval of the Concept for the Planning System for Field Tax Audits” defines the criteria for self-assessment of risks for taxpayers. What is the essence of these criteria? This important document tax service revealed the mechanism, the algorithm of how she chooses - to whom to come with an on-site tax audit. The document lists 12 criteria by which the tax authority makes this choice. If you are significant in your tax, you will most likely be checked, regardless of these criteria. But, if you are in the "golden mean", and you do not have anything suspicious by all criteria, you may not be checked. If something suspicious has appeared, then you will most likely be checked for those pain points that the tax office finds, guided by these 12 criteria.
Among these 12 criteria, one is devoted to the tax burden, the other to profitability.
The tax burden is the number one criterion. It is specified in paragraph 4 of Appendix 1, and Appendix 2 contains data on the tax burden by industry. That is, for each industry, the prevailing data on the tax burden are indicated.
How is this criterion used? If the taxpayer's tax burden is below the industry average, then the Federal Tax Service considers this as a suspicious sign. The deviation bar is taken as 10%. That is, if the tax burden in your industry is 10%, and yours, for example, is 10.5% -9.5%, then this is within the normal range. And if the tax burden is 9% or lower, then this is already a fact that can tax office interest. Therefore, it is important to monitor the tax burden of the enterprise and compare it in time with the tax burden prevailing in the industry.
These data are listed in Appendix 2 to this Order, and recently, in May, the Tax Service posted data for 2016 for the first time. I recommend that you study these data, calculate the tax burden for your company, find data on the current tax burden in your industry in the order of the Federal Tax Service of Russia, which I just gave you, and see if your tax burden differs from the industry. If it is significantly below the industry, you should be prepared to be asked about the reasons for this deviation. And you will have to explain this deviation. Situations when the tax burden of an enterprise is below the industry average, and there are no violations on the part of the enterprise, are very frequent. For some reason, you may have unprofitable activities, irrational business organization, investment expenses. I repeat, there are many such situations when your workload is lower than the industry one, but you must identify the reasons for yourself and be ready to explain them.
If you go to the official text of the Order, you will not see these data for 2016 there. Because the disclosure mechanism is usually the following. Until May 5, the Federal Tax Service uploads data to the website of the Federal Tax Service of Russia, in the form of a table in Excel. On the site nalog.ru you need to find this order. You can enter the query “self-assessment of tax risks, nalog.ru” in a search engine. Applications are marked at the bottom of the page in the form of squares. Accordingly, Appendix 2 will indicate the tax burden for each industry (for OKVED data). The file can be saved to your computer.
In 2016, the tax burden decreased, but very insignificantly. On the website, the Tax Service provides data on this burden for the whole country and separately for each industry. So, in the country it decreased to 9.6% from 9.7%. That is, for the year, from 2015 to 2016, the tax burden in the country decreased by 0.1%. The difference is insignificant, almost imperceptible.
I would like to draw your attention to the industries where the tax burden increased the most over the year:
production of leather, leather goods and footwear - 7.3% in 2016 (6.2% in 2015),
production of pulp, wood pulp, cardboard, paper and products from them - 4.3% in 2016 (3.5% in 2015),
production of coke and petroleum products - 4.7% in 2016 (2.6% in 2015).
The tax burden decreased the most in the following sectors:
extraction of fuel and energy minerals - 35.6% (41.5% in 2015),
publishing and printing activities - 11.6% (13.4 in 2015),
chemical production– 3.5% (4.2% in 2015),
construction - 10.9% (12.7% in 2015).
transactions with real estate, rent and provision of services - 15.4% (17.2% in 2015).
That is, in some sectors the tax burden has increased, in others it has decreased. Therefore, once again I recommend to find out your tax burden, compare it with the industry average and be ready to explain this difference (if it is significant) to the tax authorities.
Also in this document, the Tax Service calculates profitability and also by industry. Let me remind you that there are 12 criteria in total, according to which you can be subjected to a tax audit, and just the 11th criterion is a significant discrepancy between the level of profitability of the company and the level of profitability in the industry. By "significant difference" is meant "substantially lower". If the profitability of your enterprise is significantly higher than the industry average, it is unlikely that someone will check and punish you. For example: let's say that in your area the average profitability is 10%, and taxes come from this profit, and the profitability of your enterprise is 3%. That's the difference the tax may be interested in.
During the year (from 2015 to 2016) profitability has changed, but it has changed somehow in different directions. The fact is that the Tax Service considers profitability of two types: profitability of sales and profitability of assets. For each industry, two types of profitability are calculated: a) - sales and b) - assets.
Interestingly, in 2016, on average, return on sales declined, while return on assets increased. That is, in general, the return on sales on average decreased to 8.1% (against 9.3% in 2015), and the return on assets increased to 6.4% (against 5.0% in 2015).
Such is the strangeness. I did not choose by industry, where profitability has fallen, where it has grown. But due to the multidirectional nature of profitability, I urge you to take data from the Order of the Federal Tax Service of Russia for 2016, calculate the profitability for your industry, calculate the profitability of sales and assets for your enterprise, compare the data, and with a significant difference, ask yourself the question - why did this happen? And be prepared to answer this question if the IRS asks your company.
The indicator of profitability is important to distinguish from revenue. If revenue simply reflects the total turnover of the company (it is calculated in rubles), then profitability is the efficiency of its activities (expressed as a percentage). Any business that brought profit at the end of the period under review can be called profitable. If there is a loss, the profitability will be negative.
AT trading activities product profitability is calculated as the ratio net profit to cost.
Profitability of goods (services) \u003d net profit from sales (services) / cost * 100%.Let's say a company sells women's clothing. She bought goods in the amount of 12 million rubles, sold - for 28 million rubles. At the same time, administrative and commercial expenses amounted to 5 million rubles. Thus, the profit amounted to 11 million rubles, and the profitability of goods - 11/12*100=91%.
Profitability of sales (services) = net profit / revenue * 100%.
The profitability of services is calculated in a similar way, in this case the cost price does not take into account the purchase price of goods, but, for example, the cost of purchasing tools, remuneration of workers, etc.
The assessment takes into account the net profit and turnover of the company. If we take c as a basis, then it will be equal to = 11/28 * 100% = 39.2%. Using this formula, it is desirable to evaluate each commodity group separately. For example, the profitability of sales of T-shirts, bags, etc. This will allow you to highlight the most effective positions in the assortment, as well as those that need to be worked on to increase their profitability.
Acceptable level of profitability by industry
One acceptable level profitability does not exist, it varies depending on the industry. So, for example, in the mining industry, return on sales above 50% is considered normal, while in the woodworking industry it does not reach 1%.
According to researchers, the average Russian rate of return is about 12%. However, this value in itself is practically meaningless, if not compared with similar performance indicators of competitors or industry average values.
Please note that if the profitability of your business deviates significantly from the industry average (by 10%), this increases the likelihood of a tax audit.
According to RIA-rating, the average sales by industry in 2013 were as follows:
- extraction of minerals - 26.3%;
- chemical production - 18.3%;
- textile production - 2.8%;
- Agriculture - 11.7%;
- construction - 6.7%;
- wholesale and retail- 8.2%;
- financial activity - 0.4% (2012, Rosstat);
- healthcare - 6.5% (2012, Rosstat).
In the service sector, a profitability of 15-20% is considered acceptable.
If you have come to the conclusion that you are seriously lagging behind your competitors in terms of business efficiency, you need to work on increasing the level of profitability. This task can be achieved through a competent marketing policy aimed at increasing the customer base and ensuring the growth of the turnover of goods, as well as by obtaining more profitable offers from suppliers of goods (or subcontractors).
Sources:
- what is the rate of return
- Assessment and selection of investment
In a market economy, profit is the main indicator characterizing the efficiency of the enterprise. Profitability is a relative indicator that comprehensively reflects the level of efficiency in the use of labor, monetary, material goods and resources. By the amount of profit received, it is possible to determine the profitability of the enterprise's production, its current assets, capital, financial investments, products, services provided by the organization, etc.
You will need
- - calculator;
- - financial documents financial statements.
Instruction
First of all, consider the budget you have for producing a product or providing a service. The success and efficiency of a particular type of product primarily depends on the quality of the forecast for its further promotion on the market. This information can be obtained from the reporting for the previous year in order to use it as a base for further forecasting.
Create an investment budget. the main objective drawing up this document - to provide for all the necessary expenses, and not income, since the planned production may not be profitable at all and, accordingly, will not bring any profit.
Compare the planned budget with the investment budget in order to determine whether it is enough Money to cover the costs used to produce the product and whether new costs need to be introduced. If the amount of investment is insufficient, it is advisable to reassess the planned costs.
Consider the profitability ratio of sales(ROS). This indicator reflects the efficiency of the enterprise and shows the share (in percent) of net profit in the total revenue of the enterprise. In Western sources, the profitability ratio of sales is called - ROS ( return on sales). Below I will consider the formula for calculating this coefficient, give an example with its calculation for a domestic enterprise, describe the standard and its economic meaning.
Profitability of sales. Economic meaning of the indicator
It is advisable to start the study of any coefficient with its economic meaning. What is this ratio for? It reflects the business activity of the enterprise and determines how the enterprise works effectively. The profitability ratio of sales shows how much money from the sold products is the profit of the enterprise. What is important is not how many products the company sold, but how much net profit it earned net money from these sales.
The profitability ratio of sales describes the effectiveness of the sale of the main products of the enterprise, and also allows you to determine the share of the cost in sales.
Return on sales ratio. How is profitability calculated? Calculation formula according to balance sheet and IFRS
The formula for return on sales by Russian system accounting statement looks like this:
Return on sales ratio = Net profit / Revenue = line 2400 / line 2110
It should be clarified that when calculating the ratio, instead of net profit, the numerator can be used: gross profit, profit before taxes and interest (EBIT), profit before taxes (EBI). Accordingly, the following coefficients will appear:
Gross profit margin on sales = Gross profit/Revenue
Operating profit ratio =EBIT/Revenue
Return on sales ratio for profit before taxes =EBI/Revenue
To avoid confusion, I recommend using the formula, where the numerator is net income (NI, Net Income), because. EBIT is calculated incorrectly based on domestic reporting. It turns out the following formula for Russian reporting:
In foreign sources, the profitability ratio of sales - ROS is calculated by the following formula:

Video lesson: “Sales profitability: calculation formula, example and analysis”
Profitability of sales. An example of a balance sheet calculation for JSC Aeroflot

Let's calculate the return on sales for Russian company OJSC Aeroflot. To do this, I will use the InvestFunds service, which allows you to get the company's financial statements by quarter. Below is the import of data from the service.

Profit and Loss Statement of JSC “Aeroflot”. Calculation of the profitability ratio of sales
So, let's calculate the profitability of sales for four periods.
Return on sales ratio 2013-4 =11096946/206277137= 0.05 (5%)
Return on sales ratio 2014-1 = 3029468/46103337 = 0.06 (6%)
Return on sales ratio 2014-2 = 3390710/105675771 = 0.03 (3%)
As you can see, the return on sales slightly increased to 6% in the first quarter of 2014, and in the second quarter it doubled to 3%. However, the profitability is greater than zero.
Let's calculate this coefficient according to IFRS. To do this, we take data on financial statements from the official website of the company.

Aeroflot IFRS report. Calculation of the profitability ratio of sales
For the nine months of 2014, the return on sales ratio of JSC Aeroflot was equal to: ROS=3563/236698=0.01 (1%).
Let's calculate ROS for 9 months of 2013.
ROS=17237/222353=0.07 (7%)
As can be seen, over the year, the ratio deteriorated by 6% from 7% in 2013 to 1% in 2014.
Return on sales ratio. standard
The value of the standard value for this coefficient Kp>0. If the profitability of sales turned out to be less than zero, then you should seriously think about the effectiveness of enterprise management.
What level of sales profitability ratio is acceptable for Russia?
– mining – 26%
– agriculture – 11%
– construction – 7%
– wholesale and retail trade – 8%
If you have a low value of the coefficient, then you should increase the efficiency of enterprise management by increasing the customer base, increasing the turnover of goods, reducing the cost of goods / services from subcontractors.
Return on Sales Ratio in Excel
The degree of economic efficiency of a financial, labor or material resource characterizes such a relative indicator as profitability. It is expressed as a percentage and is widely used to evaluate the performance of a commercial enterprise. There are many types this concept. Any of them is the ratio of profit to the asset or resource under study.
The essence of the concept of profitability ratio
The profitability ratio of sales shows the business activity of the enterprise and reflects the efficiency of its work. Evaluation of the indicator allows you to determine how much money from the sale of products is the profit of the company. What matters is not how much product was sold, but how much net profit the company earned. With the help of the indicator, you can also find the share of cost in sales.
The profitability ratio of sales is analyzed, as a rule, in dynamics.
Profitability assessment
An increase or decrease in an indicator indicates various economic phenomena.
If profitability increases:
- The increase in revenue occurs faster than the increase in costs (either increased sales volumes, or changed the assortment).
- Costs are declining faster than revenue is declining (the company has either raised product prices or changed the assortment structure).
- Revenue is growing, and costs are becoming smaller (prices have increased, assortment has changed, or cost rates have changed).
The first two situations are definitely favorable for the company. Further analysis is aimed at assessing the sustainability of this situation.
The second situation for the company cannot be called unambiguously favorable. After all, the profitability indicator has improved formally (revenue has decreased). To make decisions, analyze pricing, assortment.
If profitability declines:
- Costs are rising faster than revenue (due to inflation, price cuts, increased cost rates, or changes in product mix).
- The decrease in revenue is faster than the decrease in costs (sales fell).
- Revenues are getting smaller and costs are getting bigger (cost rates have increased, prices have gone down, or the assortment has changed).
The first trend is clearly unfavorable. An additional analysis of the causes is needed to correct the situation. The second situation indicates the desire of the company to reduce its sphere of influence in the market. When a third trend is found, pricing, assortment, and cost control systems need to be analyzed.
How to Calculate Return on Sales in Excel
The international designation of the indicator is ROS. The return on sales ratio is always calculated from the sales profit.
Traditional formula:
ROS = (Profit/Revenue) * 100%.
In specific situations, it may be necessary to calculate the share of gross, balance or other profit in revenue.
Gross return on sales (margin) formula:
(Gross Profit / Sales Proceeds) * 100%.
This indicator shows the level of "dirty" money (before all deductions) earned by the company from the sale of products. Formula elements are taken in monetary terms. Gross profit and revenue can be found in the income statement.
Information for calculation:
In the cells for calculating the gross margin, set the percentage format. We enter the formula:

Gross profit margin for 3 years is relatively stable. This means that the company carefully monitors the pricing procedure, monitors the product range.
Return on sales by operating income (EBIT):
(Operating profit / sales revenue) * 100%.
The indicator characterizes how much operating profit falls on the ruble of revenue.
((p. 2300 + p. 2330) / p. 2110) * 100%.
Data for calculation:

Calculate the operating profit margin - substitute the references to the required cells in the formula:

The formula for return on sales by net profit:
(Net profit / revenue) * 100%.
Net profitability shows how much net profit falls on the ruble of revenue. Both figures are taken from the income statement.

Let's show the profitability ratio of sales on the chart:

In 2015, the indicator is significantly reduced, which is regarded as an unfavorable phenomenon. Additional analysis needed assortment list, pricing and cost control systems.
A value above zero is considered normal. A more specific range depends on the field of activity. Each enterprise compares its sales profitability ratio and the standard value for the industry. It is good if the calculated indicator practically does not differ from the inflation rate.
 |
Back to Profitability 2017
— wholesale – 10,5%
— retail trade – 3.6%
— construction – 6.7%
Also, one should not forget about such a criterion as a relatively low tax burden, which is noticeably below the average level in the context of all economic entities in a particular industry.
It can also attract increased attention from the tax authorities.
— change in the cost of raw materials;
- the impact of competition, etc.
Average profitability and tax burden
Many are familiar with the concept of tax audit risk assessment, as well as the dependence of the magnitude of this risk on factors such as the size of the tax burden, the almost equal amounts of income and expenses of the organization, or the payment of salaries that are below the national average. Among these factors is the indicator of profitability in the statistics of the enterprise. It is no secret that if it seriously deviates from the level of profitability calculated by the Ministry of Finance for this area of activity, this will inevitably entail an inspection by the Federal Tax Service.
Profitability by type of activity
The Federal Tax Service publishes average profitability indicators on its official website.
So, today the actual numbers are the following values:
– wholesale trade – 10.5%
— retail trade – 3.6%
— construction – 6.7%
Profitability ratios by industry should be taken into account when assessing the risk of a tax audit of your organization. When conducting field tax control, inspectors quite often pay attention to the organization's profitability statistics, so this criterion can also be used by taxpayers who want to adjust the results of their financial and economic activities in order to reduce the risk of falling into the field of view of tax inspectors. A significant deviation is considered to be profitability, which differs by more than 10% from the indicators of similar industries and organizations.
Also, one should not forget about such a criterion as a relatively low tax burden, which is noticeably below the average level in the context of all economic entities in a particular industry. It can also attract increased attention from the tax authorities.
What percentage of return is considered acceptable
Average profitability
When calculating profitability, two important indicators must be obtained accounting: return on assets and return on sales. Then the figures obtained must be compared with the average level of profitability for your type of activity (main). Industry profitability is always indicated in special reference books that are regularly published by Rosstat.
Experts consider the following to be significant factors influencing the amount of profitability:
— change in the cost of raw materials;
- skill level work force;
- too small or large markup;
— the presence or absence of discounts;
- the impact of competition, etc.
A significant deviation from the level of profitability established for a particular area of activity will attract the attention of the Federal Tax Service.
As can be seen from the material presented, the areas of activity for which there was a decrease in the level of profitability in 2017 (compared to 2016) are as follows:
– wholesale trade;
– production of electrical equipment;
- production Vehicle.
Spheres such as construction and transport remained at the same level (a slight percentage decrease in the level of profitability).
It should be noted that a significant deviation of the level of profitability from statistical indicators (established for specific types of activities) will attract attention from regulatory authorities. The tax authorities take into account the deviation of the level of profitability according to the company's data (accounting data) from the industry average of no more than 10%.
Similar conclusions can be drawn about the impact of the tax burden on the coefficient, since an increase in taxes (except for indirect ones in cases where the burden of the tax burden is shifted to buyers) leads to a decrease in both net profit and assets of the enterprise, then the return on assets ratio decreases with growth taxes similar to the return on equity ratio (except for the increase in indirect taxes passed on to buyers).
It should be noted that the size of the tax burden does not affect the volume of sales (i.e., the denominator of the coefficient), therefore, the result of an increase in taxes is a decrease in net profit (i.e., the numerator of the coefficient) and a decrease in the sales profitability ratio.
Thus, the growth of the tax burden, leading to an increase in government revenues, causes a decrease in such important indicators of financial stability commercial organization, as different profitability ratios (with the exception of cases of an increase in indirect taxes, which are reimbursed by buyers and in this case practically do not affect the profitability of enterprises).
The Federal Tax Service has updated the tax burden by industry and type economic activity for 2019. Its tax authorities use it primarily when preparing a plan for on-site inspections. Therefore, the company must calculate the load itself in advance in order to reduce the risk of verification.
The Federal Tax Service has changed the safe tax burden
A company can assess the likelihood of an audit even if the tax authorities have not determined the industry average indicators of the tax burden for its activities. The Federal Tax Service suggested in a new letter,
Calculation formula
There is formula for calculating the tax burden. It is necessary to divide the total amount of taxes paid / accrued by the total amount of revenue for the year and multiply by 100 percent. The result obtained can be compared with the table of indicators of the Federal Tax Service.
Where Taxes - the total amount of taxes paid / accrued for the period,
Revenue is the company's revenue for the year.
Example:
Last year, the company paid total budget taxes in the amount of 4,200,000 rubles, and the total revenue amounted to 98 million rubles. The company is engaged in wood processing. We calculate the tax burden as follows: we divide 4.2 million by 98 million and multiply by 100%, we get the tax burden - 4.3%. We compare this value with the indicator for a similar type of activity in the table, which is 2.8%. It turns out that the tax burden in the company corresponds to the average value and the risk of being included in the field audit is small.
Indicators of the tax burden by industry and type of economic activity according to the Federal Tax Service of Russia
|
Type of economic activity (industry) |
|||
|
Agriculture, hunting and forestry |
|||
|
Fishing, fish farming |
|||
|
Mining including: |
|||
|
extraction of fuel and energy minerals |
45,4 | ||
|
extraction of minerals, except for fuel and energy |
18,8 | ||
|
Manufacturing industries including: |
|||
|
production food products, including drinks, and tobacco |
|||
|
textile and clothing production |
|||
|
manufacture of leather, leather goods and footwear |
|||
|
woodworking and manufacture of wood and cork products, except furniture |
|||
|
production of pulp, wood pulp, paper, cardboard and products from them |
|||
|
publishing and printing activities, replication of recorded media |
|||
|
production of coke and petroleum products |
|||
|
chemical production |
|||
|
production of rubber and plastic products |
|||
|
production of other non-metallic mineral products |
|||
|
metallurgical production and production of finished metal products |
|||
|
production of machinery and equipment |
|||
|
production of electrical, electronic and optical equipment |
|||
|
production of vehicles and equipment |
|||
|
Production and distribution of electricity, gas and water |
|||
|
production, transmission and distribution of electrical energy |
|||
|
production and distribution of gaseous fuels |
|||
|
production, transmission and distribution of steam and hot water (thermal energy) |
|||
|
Construction |
|||
|
Wholesale and retail trade; repair of vehicles, motorcycles, household and personal items, including: |
|||
|
trade in motor vehicles and motorcycles, their Maintenance and repair |
|||
|
wholesale trade, including trade through agents, except for motor vehicles and motorcycles |
|||
|
retail trade, except for motor vehicles and motorcycles; repair of household and personal items |
|||
|
Hotels and restaurants |
|||
|
Transport and communications including: |
|||
|
rail transport activities |
|||
|
pipeline transportation |
|||
|
water transport activity |
|||
|
Operations with real estate, rent and provision of services |
|||
|
Activities administrative and related additional services |
15,4 |
* The calculation for 2015 - 2017 is made without taking into account receipts from the unified social tax and insurance premiums for compulsory pension insurance.